Making Expected Goal Charts in R

Visualizing hockey games has never been easier, with the data made available through sites like Moneypuck and EvolvingHockey. In a few easy steps, we can take raw data from sites like these and produce visuals that nicely summarize how a particular game was played. We’re going to recreate a chart like the one below that visualize expected goals over the course of a game. Let’s jump right in.

An example Expected Goals chart from EvolvingHockey.com

Getting Data from Moneypuck.com

Moneypuck is a great resource for publicly available data, which we will pull down to create our very own Expected Goal game charts. We are particularly interested in the shot data, available here for download, but we will pull this data in without leaving R using the code below.

library(tidyverse)
library(downloader)

download("http://peter-tanner.com/moneypuck/downloads/shots_2019.zip", dest="dataset.zip", mode="wb") #downloads the zip file
unzip ("dataset.zip", exdir = ".") #unzip the file into our directory
shots = read_csv("shots_2019.csv") #read in the shots csv file

What we’ve just done is taken the url of the zip file on the moneypuck site, downloaded the zip file, unzipped its contents into our directory, and read in the shots csv file for analysis. Now we are ready to wrangle our shots data with the goal of plotting the expected goals of one game over time, for both teams involved.

Wrangling our Shots data for Plotting

Before we jump into the data, it’s worth pausing and thinking about what we want our visual to look like. This will inform any variables we need to alter or create ahead of time, and reduce any back tracking you may need to do later.

The shots data, as the name suggest, includes all the shots taken in the 2019-2020 season to date. The observations alone are powerful, and Moneypuck even includes the results of it’s Expected Goals model we can leverage in our visuals. I encourage readers to poke around the data file and see what else could be of interest.

To start – we want to visualize just one game – so let’s filter down our data set to look at a game. We’ll use the game_id variable to do this:

game_to_chart = 20951 #insert game_id we want to chart

shots %>% 
  filter(game_id == game_to_chart) #filter data to this game

Pretty neat – now we have just the shots taken in the ludicrous display last night that was the Leafs vs. Hurricanes game. You can filter any other game_id you desire by just replacing the value in the game_to_chart variable we created. Our end goal is to create a cumulative expected goals chart like the ones featured on various analytics sites, and the next step requires a little forethought.

We have observations for each shot, the xG for that shot, and the time in seconds of when that shot was taken. What happens if there was a second in the game where a shot wasn’t taken? How would our plot look? We can imagine a plot where the Leafs go 5 minutes without a shot, and our chart would jump from one value to another, which can be misleading. What we need to do is “pad” our data with observations for each second, using the padr package as below:

library(padr)
shots %>% 
  filter(game_id == game_to_chart) %>%
  pad_int('time', group = 'teamCode', start_val = 0, end_val = 3600) %>%  #pad data for seconds without a shot
  mutate(xGoal = ifelse(is.na(xGoal),0,xGoal)) #convert NAs to 0 so they are plotted

Now we have observations for each second in the game. Since we’re going to plot xGoals, we also replaced missing values with 0 using ifelse so they aren’t dropped from our plot. Next, we’re ready to take the cumulative sum of expected goals so we can see how the game progressed over time:

shots %>% 
  filter(game_id == game_to_chart) %>%
  pad_int('time', group = 'teamCode', start_val = 0, end_val = 3600) %>%  #pad data for seconds without a shot
  mutate(xGoal = ifelse(is.na(xGoal),0,xGoal)) %>%  #convert NAs to 0 so they are plotted
  group_by(teamCode) %>%
  mutate(cumulativexG = cumsum(xGoal)) #take cumulative sum to add up xG over time

Time to Plot!

Time to ggplot! We have our data in a format that will allow us to visualize the expected goal trends for a game – so let’s see what it looks like:

shots %>% 
  filter(game_id == game_to_chart) %>%
  pad_int('time', group = 'teamCode', start_val = 0, end_val = 3600) %>%  #pad data for seconds without a shot
  mutate(xGoal = ifelse(is.na(xGoal),0,xGoal)) %>%  #convert NAs to 0 so they are plotted
  group_by(teamCode) %>%
  mutate(cumulativexG = cumsum(xGoal)) %>%  #take cumulative sum to add up xG over time
  ggplot(aes(time, cumulativexG, group = teamCode, color = teamCode)) +
  geom_line()

Pretty cool! We can see that Carolina basically dominated this one from start to finish. We can identify periods of time where a team was dominant, like the first few minutes for Carolina, as well as periods where chances flatlined, like most of the game for the Leafs.

This is a good start, but we may want to add another dimension – one that would allow us to see when an actual goal occurred. We’re going to do that by filtering a new layer of our plot so that it just includes goals. This is made easier if we create a new object, and assign it to what we want to plot:

plot = shots %>% 
  filter(game_id == game_to_chart) %>%
  pad_int('time', group = 'teamCode', start_val = 0, end_val = 3600) %>%  #pad data for seconds without a shot
  mutate(xGoal = ifelse(is.na(xGoal),0,xGoal)) %>%  #convert NAs to 0 so they are plotted
  group_by(teamCode) %>%
  mutate(cumulativexG = cumsum(xGoal))  #take cumulative sum to add up xG over time
 
plot %>%  
  ggplot(aes(time, cumulativexG, group = teamCode, color = teamCode)) +
  geom_line() +
  geom_point(data = plot %>% filter(goal == 1))

Now we can see when the goals occurred in this game. The Leafs got out to a 1-0 lead despite being outchanced, before the Hurricanes rattled off the next 4 goals. We have a pretty decent overhead view of how this game transpired at this point. Let’s clean it up and call it a day:

#Packages required for the ggplot theme
library(awtools)
library(showtext)
library(extrafont)
font_add_google("IBM Plex Mono", "IBM Plex Mono")
font_add_google("IBM Plex Sans", "IBM Plex Sans")
showtext_auto()

plot %>%  
  ggplot(aes(time, cumulativexG, group = teamCode, color = teamCode)) +
  geom_line(size = 1.5) +
  geom_point(data = plot %>% filter(goal == 1), fill = "white", size = 3.5, alpha = 0.9, shape = 21, stroke = 1.5) +
  geom_vline(xintercept = c(1200,2400,3600), color = "grey", alpha = 0.4) +
  geom_hline(yintercept = c(1,2,3,4), color = "grey", alpha = 0.4) +
  a_plex_theme(grid = FALSE) +
  scale_color_manual(values = c('#CC0000', '#00205B')) +
  labs(title = "TOR 3 vs. CAR 6", subtitle = "Toronto was felled by the Carolina Hurricanes and stud goaltender and zamboni driver, David Ayers. \nThe Leafs have stumbled the past few games, struggling to string games of solid effort together. \nLuckily, the Panthers lost to Vegas in their matchup.", x = "Game Seconds", y = "Expected Goals", caption = "Chart by @MackinawStats, data from @Moneypuck") +
  scale_x_continuous(breaks = c(1200,2400,3600)) +
  geom_label(data = plot %>% filter(time == 3600), aes(label = teamCode), vjust = 1.5) +
  theme(legend.position = "none")

Potential Additions and Happy Charting

There are a lot of game aspects our chart leaves out, like any powerplays the teams had, or the fact that the Hurricanes had to play 3 different goalies, one of which may have had to clean the ice at the conclusion of the game. There are always additional layers and annotations that can be worth adding, subject for a future post. Enjoy!

-Mackinaw Stats

Advertisement

The Leaf’s Bumpy Ride: The Season’s Narrative Through Leafs Twitter

The mind of a leaf’s fan is a chaotic place – we’ve all found ourselves waffling over twitter arguments. Last year it was Nylander is a bum, then we piled on Barrie as he appeared to forget how to skate, and this week I found out Matthews sucks ass at hockey. While some of these arguments are worth having, most of them are a product of results, and if we track leafs fan’s sentiment over the course of the season, we can tell a pretty interesting story about what has transpired.

I have been tracking tweets containing either “Maple Leafs” or “Leafs” from the start of the season, and using the bing sentiment journal to quantify how positive or negative these tweets have been on a given day. The chart that will follow the narrative reads as follows: data points the fall to the left of the 0% line are days where tweets were more negative than positive, while tweets on the right are more positive. The Y-axis is the day of the season starting on October 3rd (non-game days are included). The 5 day rolling trend is shown in blue with individual data points in the background.

The Leafs Seem Good (Opener to 10/16)

The Leafs play a classic trick by collecting points despite playing like trash. One tweet reads: “Maple Leafs turn to Hutchinson to keep streak alive”. We still thought we could win a back-to-back, which is cute. Now we’re not turning to Hutch for anything but an excuse for losing to Buffalo. Leafs fans were positive but souring especially after Tampa fed us our lunch in a 7-3 game.

Leafs Seem Mediocre? (10/17 to 11/1)

Leafs begin to struggle – Ovechkin’s sage advice was taken to heart by the fans (and our coach) as the team struggles to pick up points. The Leafs get owned by the Habs on a back-to-back, and we see the first inklings of the “Fire Babcock” tweets. One tweet reads “There are fans of the Toronto Maple Leafs?”. Unfortunately, yes there are.

Leafs are turning it around! (11/2 to 11/7)

You’ll notice this is the shortest segment of the season. The Leafs win three straight and we all grabbed out popcorn to watch this team begin domination. The 5 day sentiment average hit a high. Babcock thought barely beating the Kings was “beautiful”. We should have known he was a sociopath.

Leaf did not turn it around (11/8 to 11/21)

Buckle up, the Leafs begin their descent, losing 6 straight games. The reality the Leafs could miss the playoff sinks in, and the fanbase resorts to 2014-15 levels of depression, without the hope of landing Matthews. One leafs fan tweets “Are they just extra stinky this year?”

Keefe takes over (11/21 to present)

Sentiment rebounds once Keefe takes over, and hopes of an unshackled Leafs team float in Leafs fan’s heads. The recent losses made things a little volatile, but there remains optimism of a turnaround despite shaky on-ice results. On tweet reads “Ready to talk some shit about the Maple Leafs.” Aren’t we all?

-Mackinaw Stats. Data pulled via the Twitter API. Charts are my own.

Barrie’s Bounce-back: A first look at on-ice improvements under Sheldon Keefe

Sheldon Keefe couldn’t have written it better himself. A struggling offensive defenseman is unleashed under a new coach and system, quickly potting his first and second goals of the season. Barrie has served as a useful metaphor for both the changing direction of the team, and Leafs fans’ sentiment following two recent wins. While we only have a two game sample size for Keefe’s Leafs, Barrie serves as a good example of how Keefe’s system enables the roster to play to their strengths, instead of forcing a gritty defensive style on offensively gifted players. The side-by-side image below mirrors the feelings of a lot of Leafs fans this past week. Barrie’s longing smirk following an October loss has turned to an optimistic smile, as he, and leafs fans alike hope to build on their recent wins.

barrie

While it’s too early for a more scientific analysis of Barrie’s bounce-back – this post will investigate some of the improvements we’ve seen in his game since the coaching change, and investigate some of the reasons Barrie seems more like himself under Keefe.

Keefe’s Relief

So how much better has Barrie been since Keefe has taken the helm? We’ve obviously seen the results on the scoresheet – but we wouldn’t expect Barrie to shoot 0% all year, even under Babcock. The eye-test suggest Barrie is performing much better – perhaps boosted by a combination of Keefe’s system and newfound confidence/energy. Barrie looks like what Leaf’s fans were expecting when the Kadri trade went through – a dynamic and offensively gifted defenseman with a high propensity of jumping up in the play and creating chances offensively. Under Babcock, we were used to seeing Barrie throw low-danger chances from the point, and now Barrie has two goals where he held the puck for a much more dangers chance right in the slot. Let’s take a look at the numbers to see if they suggest a large improvement.

I’ll be using expected goals to analyze Barrie’s performance – a model that takes into account things like shot location and angle for assessing shots. If we look at Barrie’s on ice expected goals at 5v5, we’ll first notice his struggles over the course of the season in helping generate offense and preventing chances on defense. Since early October, when Barrie’s been on the ice, the opposition has generated more chances in almost every single game. In the past three games, this trend has reversed as Barrie and his linemates have controlled quality chances against the opposition:

Capture

There are a few reasons why this could be – you’ll notice a decent amount of volatility in the chart above so maybe it’s random. It could be a string of easy competition that has buoyed the team’s overall Expected Goals. I am going to take a deeper look into Barrie’s on-ice shot locations, and his usage as potential reasons for his apparent improvement.

Shot Locations

Prior to Babcock’s departure, there was a lot of discussion about the Leaf’s sudden inability to generate quality chances. Specifically, the good folks at Pension Plan Puppets wrote this piece about the repeatability of Expected Goals and Ian Tulloch of The Athletic wrote about the Leaf’s struggles and attributes it to the defense activating into the play. The lack of high danger scoring chances, and reliance on point shots had a lot of us scratching our heads, and shot happy defensemen like Barrie were beginning to frustrate fans. Barrie is a useful case study in seeing just how much things have changed on offense, and if the new system is creating better opportunities for Barrie and his linemates.

The below heatmap comparison is relatively encouraging for Leafs fans. It supports the trend in Expected Goals we noted above, in that shot locations appear to be moving away from the points and towards the slot. The first chart shows Barrie’s on-ice 5v5 heatmap for the entire season, and two things jump out. In the Leaf’s defensive end, things are a little concerning with what appears like a whole lot of chances in front of the leafs net. On offense, things look similar but we also have point shots, particularly on Barrie’s right side being a popular shot location.

The heatmap for the 2 games since the coaching change look slightly better, though an obvious small sample caveat given the limited data. Barrie showed an improvement in his own end, with shots mostly occurring outside the high-danger area. On offense, there are still some point shots being taken, but a majority of the shots are being taken from below the circles. Barrie, and the rest of the Leafs defensemen for the matter, are a shot happy bunch, and I wouldn’t expect shots from distance to entirely dry up, but it is encouraging to see more quality chances being taken. Barrie’s first goal, where instead of being stagnant at the point and floating a wrister, he kept his feet moving and cut into the danger area, is hopefully what we see more of.

barrieallbarriesince

Usage

Barrie’s changing usage also shouldn’t be ignored, as he has moved onto the third pairing with Travis Dermott and is facing less talented opposition. A quite enjoy Micah Blake McCurdy’s viz for illustrating TOI versus competition, which is included below. The size of the square indicates the amount of 5v5 time the given pair played against one another, and the area fill represents shot share during that time. Against Colorado, Barrie largely avoided the MacKinnon line – spending most of their time against the Kadri and Kamenev lines. Similarly against Arizona, Barrie matched up most often against the Coyote’s fourth line and 3rd defensive pair.

The shot share results were particularly good in the game against the Coyotes, and could be seen as an encouraging sign of Barrie’s new usage. Sheltering him against top competition will help get his confidence up in the short term, and provide lots of opportunity to join in the rush and create goals for the long term.

There are reasons the good performances could be a one-off – the Coyotes didn’t look like a great hockey team and Barrie was likely to play with intensity against his old team – but the results are encouraging, or at least, more encouraging than the first 23 games. As noted potty mouth John Tavares would say, let’s ****ing build on this Barrie!

-Mackinaw Stats

Data from Evolving Hockey and TOI viz from hockeyviz.com

Sound Bites with Mike: Sentiment Analysis of Mike Babcock’s Post-Game Pressers

After each NHL game, the press gathers to poke and prod the coaches on certain occurrences, hoping for an interesting or provocative quote for their outlet. For the most part, the interactions are uneventful – coaches defer more pointed questions, or consult their rotating list of common phrases, like “get the puck deep” or “get pucks to the net”. So what kind of value or insight can we glean from these conversations? Is Mike Babcock’s assessment an accurate reflection of a game’s result, or of a run of games when the team might be hot or struggling? I’ve pulled the YouTube transcripts from the 82 post-game interviews with Mike Babcock from last year, and the ensuing sentiment analysis will determine if he’s a gud pro, or not.

How to Be Like Mike

How do you talk like Mike? By using the word good a lot, which was Babcock’s most frequently used word (common words such as and, the, you, we, etc. were excluded). The list presented below isn’t entirely surprising – Leafs fans are well aware of Mike’s overuse of the adjective, and we also see some tendency to the simplistic coach-talk mentioned in the intro. Turns out repeatedly saying “He was real good tonight” turns up in the transcripts (and can net you $50 million dollars, if you also win a cup).

babcockfreq

Making Mike Happy

It isn’t always easy to predict what Babcock’s take will be on a game – sometimes Leafs fans will feel he’s hit the nail on the head, other times he appears overly-critical of players who seemed to have a good game.

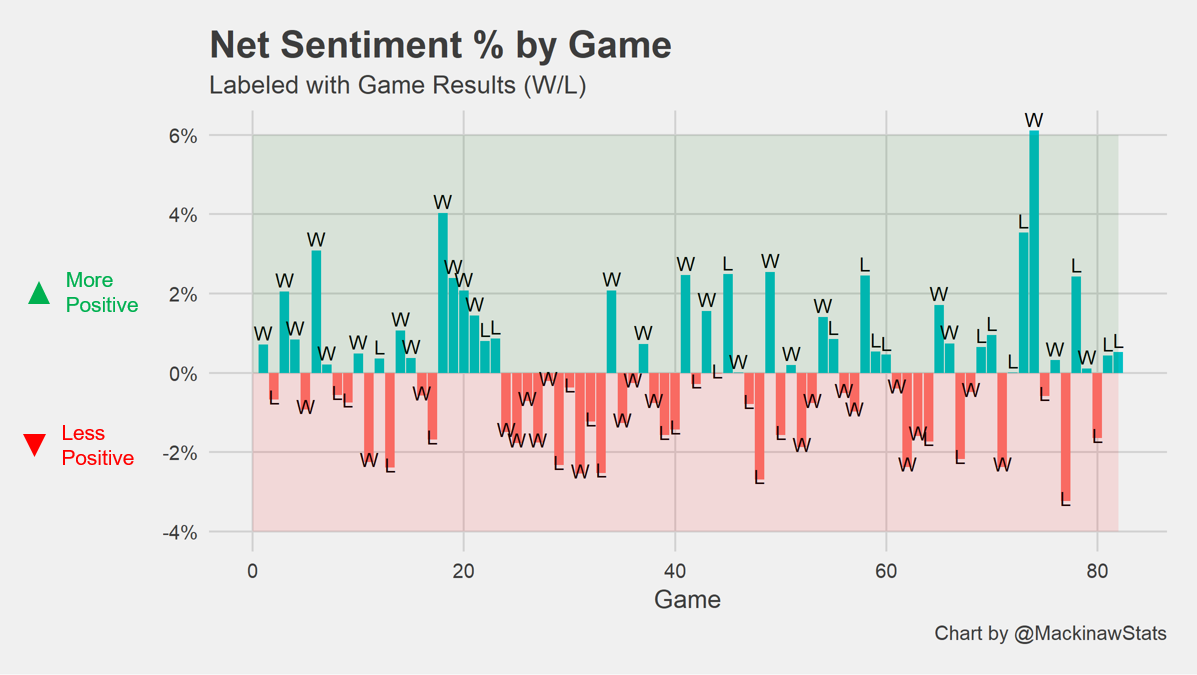
So how well does his post-game comments reflect the Win-Loss results of the team? To find this out, we can assign a sentiment value (positive words: +1 /neutral: 0 /negative: -1) to each word in his post-game interviews, and add these up for each game. To control for longer interviews with more words, we’ll divide this sum by the total amount of words in the interview, resulting in a Positivity Percentage for each game. Finally, we’ll compare each Positivity Percentage for a given night to his seasonal average. On average, 6% of Babcock’s words were positive on a given night – if Mike is particularly angry on a given night and only 4% of his words were positive – the Net Positivity Percentage would be -2%.

sentimentlogfixed

The nearby chart displays Babcock’s net positivity on a game-to-game basis, along with the game result on top of the bars. Early on in the season, Babcock’s sentiment tracked pretty well with game results – for the first 10 wins he had more positive words in 8 of those games. Babcock was enthused through Game 20, which was the end of the California trip that they swept, after also winning 3 of the previous 4 games. Things took a bit of a turn after poor results against Carolina and Columbus – the following 10 games he was more negative than usual, despite a string of 5 wins.

The rest of the season was pretty up and down, and we can attribute a few reasons for games that might not match:

  • Backcock purposely dictates his words – not wanting to get too high with the highs, or too low with the lows.
  • The team may have played poorly, but still won (i.e Games 26 & 27 the Leafs won with a 40% Corsi).
  • Responses could have been dictated by reporter’s questions – which may have honed in on negative aspects of the game, instead of positive.
  • Methodology limitations may attribute words like “kill” in as in “penalty kill” as a negative, though it may not be.

On average though, Babcock is slightly more likely to use positive words when the Leafs win. We observe an average positivity percent of 6.3% when the Leafs win, versus a 5.6% positivity percent for games the Leafs lose.

posdistfixed.png

The games where Mike was most positive last year were against Buffalo and Los Angeles – here is one quote from the Buffalo game to give you an idea of how that number ended up particularly high:

Well I thought we played real well last night and weren’t rewarded in the end and I thought we played real well here tonight and were rewarded so you know I like that we played hard and did things well and stuck together and played the right way. I thought he was real good I thought we had lots of good players tonight.” – Mike Babcock, 4-2 W Buffalo

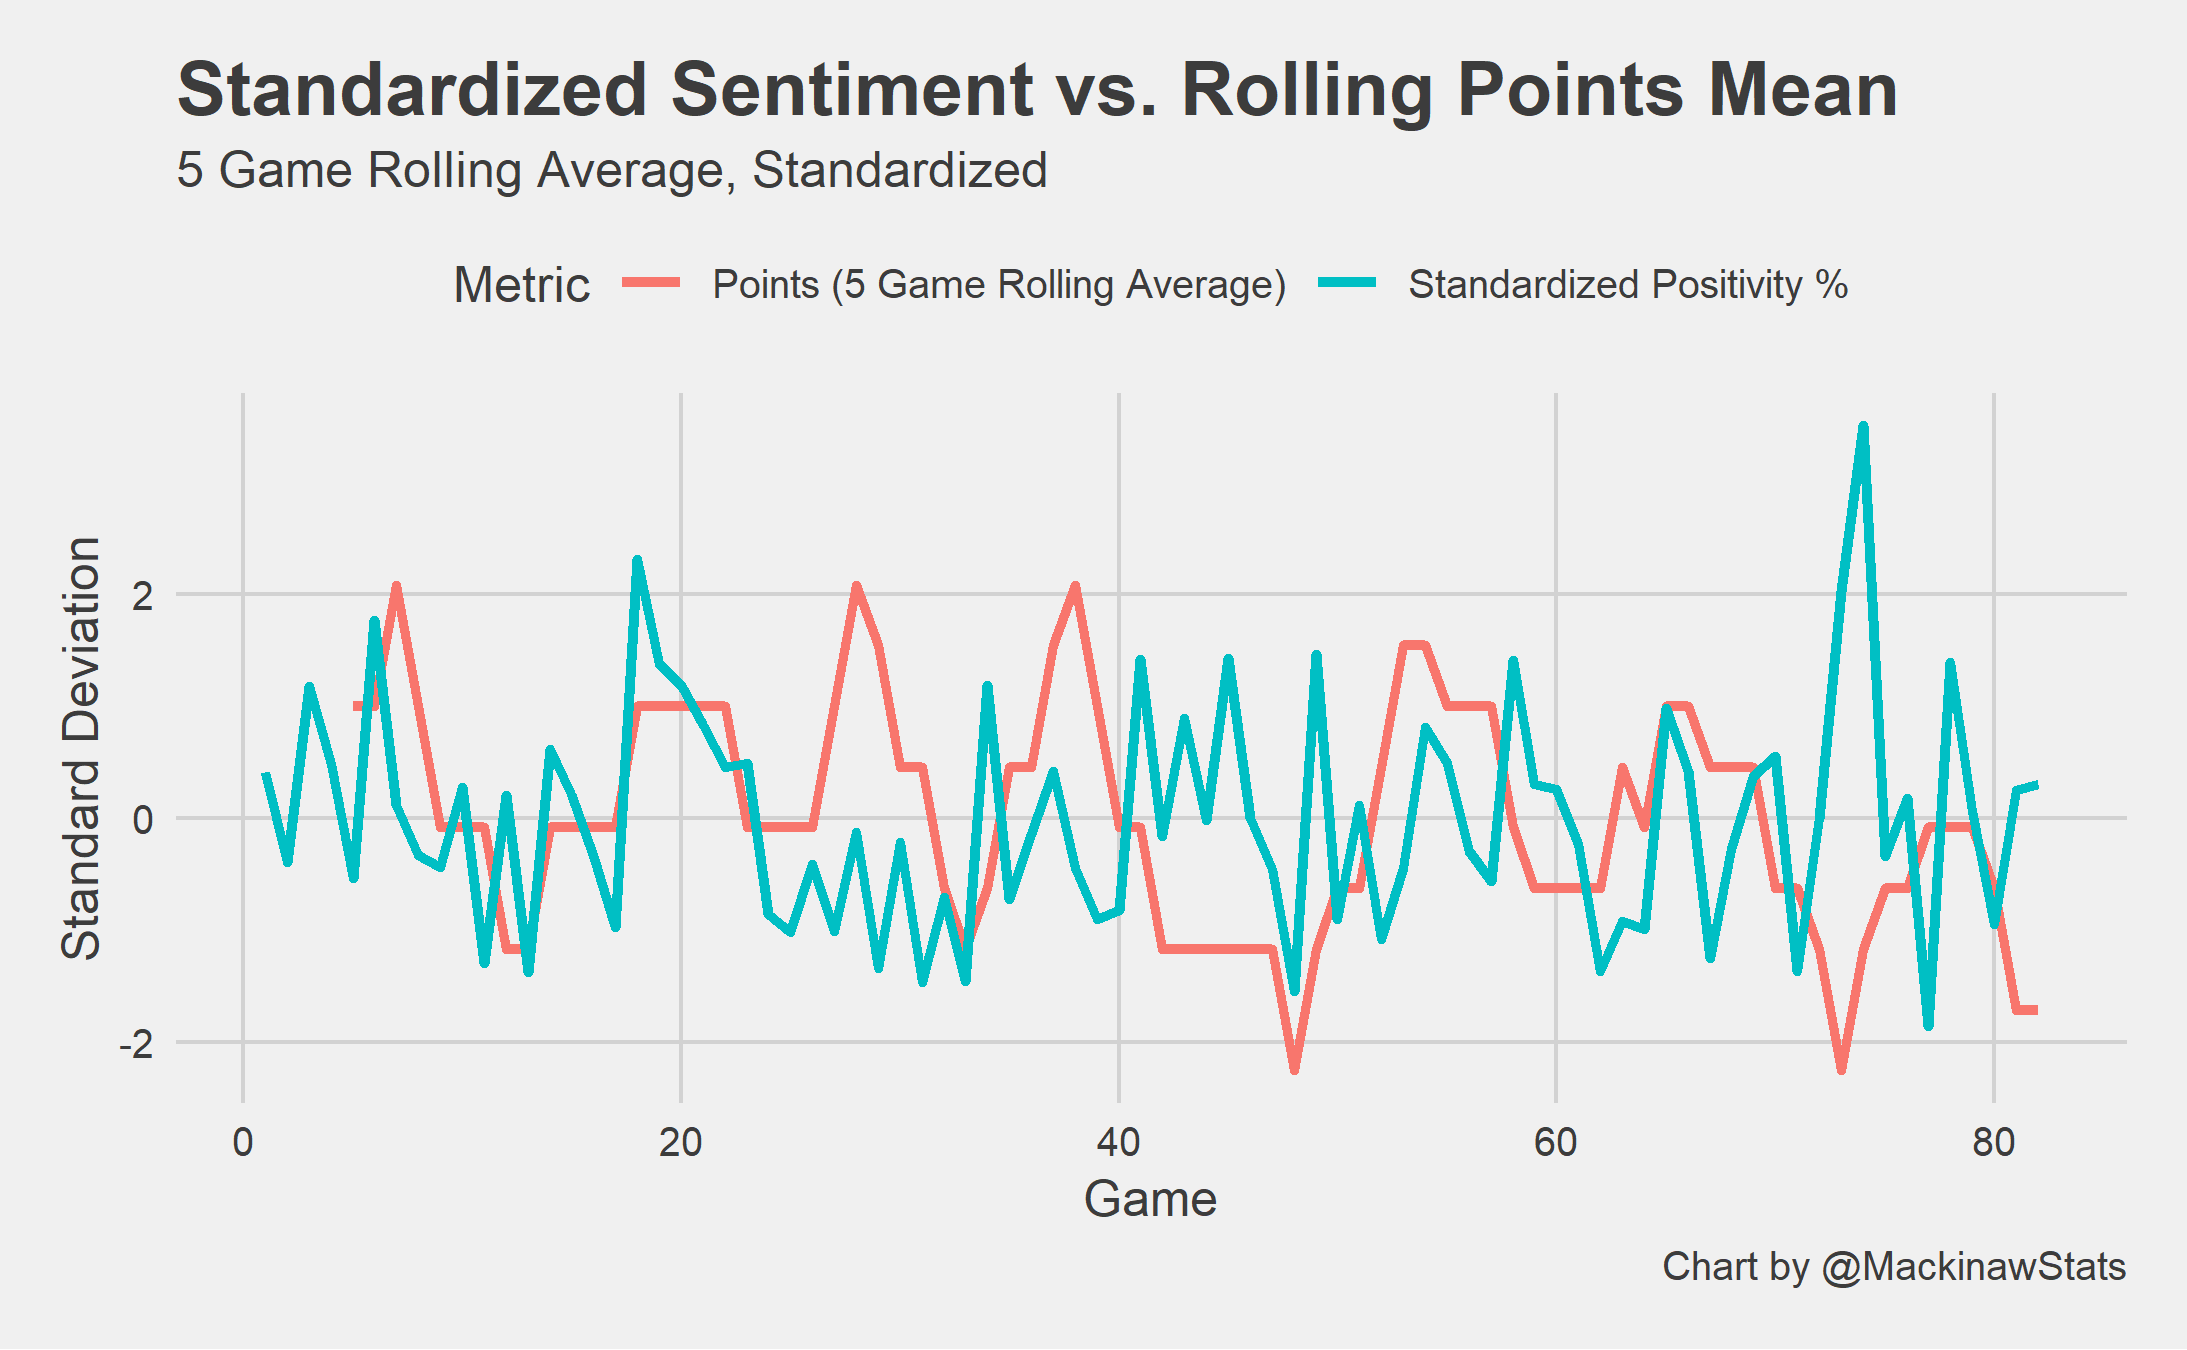
Another reason we could see deviations between positivity and results is Babcock’s susceptibility to trends in the season (winning/losing streaks). Perhaps his positivity will carry over into a loss if the Leafs have won the previous couple games. To account for this, we can take a look at the Leaf’s 5 game rolling average in comparison to his positivity, and see how well they track. These metrics are both standardized to allow for comparability:

rollmeanpoints

There are a few blips that we may not expect, but also a lot of stretches where his positivity tracked closely with the 5 game trend. It’s relatively safe to say that Babcock is just as susceptible to the ups and downs of the season as us Leafs fans!

The next step for this type of analysis is to graduate for wins and losses to other metrics that might dictate Babcock’s sentiment. His reactions could be different when the Leafs win by 2 goals instead of 1, or his reactions might be different when the Leafs outshoot their opponent and lose vs. being outplayed and winning. Whatever it is, we hope the Leafs can make Mike happy when the season starts next week.

-Mackinaw Stats

-Transcripts pulled from YouTube Post-Game Videos

-Results data from HockeyReference.com, all charts are by MackinawStats

Introducing Consistency to Expected Goals

Diving Deeper Than Averages

Since the advent of basic player statistics, per game or season averages have been frequently used to evaluate player performance, in all sports including hockey. Averages allow us to distill an overwhelming amount of information into a simple, catch-all number that can lead to a better understanding of player contribution. What has received slightly less attention than the average, is the variance of a player’s performance – or how often the average is representative of individual data points.

Essentially this is an evaluation of player consistency – is player X scoring a point a game for 5 games, or is he scoring 5 points in one night and 0 for the other 4 games? There may be preferential status granted to a player who is able to consistently perform: a role player who puts up a point every 3 games is potentially more valuable than one who scores 3 points in 1 game, and then 0 points in the next 8 games.

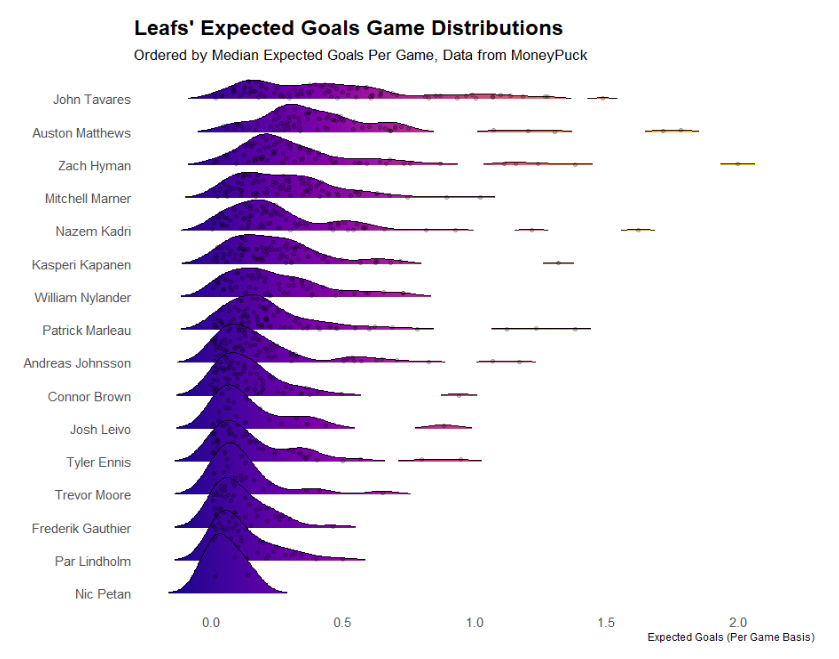
Let’s first take a look at the distributions of Expected Goals on the Toronto Maple Leafs – specifically this chart below. We can look at a players per game average to gauge who is  performing well, but how do we evaluate consistency – who is more likely to perform closer to their mean in a given game? Ennis seems to have more volatile performances – is there a way we can quantify his volatility?

Image

You’ll notice players at the bottom of the chart, with xG performances more clumped together, are players at the bottom of the leafs lineup. This isn’t all too surprising – Par Lindholm isn’t really capable of putting up an xG performance above 1.0 and so we shouldn’t expect his variance to be very high either: he’s consistently mediocre or bad. This fact should be taken into consideration when we go about creating a consistency metric.

Introducing Coefficient of Variation

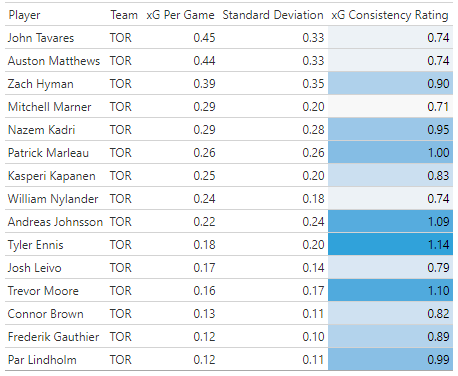
The metric I plan on using is a player’s Coefficient of Variation – which has been used in the past to measure Fantasy Football players’ consistently – as in this piece. It’s very simply the player’s average in a given metric (xG in our case) divided by the player’s standard deviation for that metric. This will help distinguish players who are consistently bad vs. consistently good, or somewhere in between. I’ll consider the metric the “xG Consistency Rating” moving forward.

leafscon.png

Given this calculation we should consider players with lower “xG Consistency” numbers to be more consistent, where higher ones (where the mean and standard deviation are closer) should be considered less consistent. For the Leafs, this metric matches up reasonably well with the eye test. Marner, Nylander, Tavares, and Matthews are the leafs most consistent players from an xG perspective, and they are known for consistently generating offense for the Leaf’s offense. On the more inconsistent side of the spectrum we find Ennis, Moore, and Johnsson – players who were subject to role changes, or had less ice time to play with to generate Expected Goals (we should also beware of small sample sizes, particularly for Moore).

Looking League-wide

While this post has leveraged the Leafs as a case study in consistency, the metric can be applied to the larger league – and implemented to player evaluations using metrics beyond Expected Goals. The nearby chart is an illustration of Expected Goals vs. Expected Goals consistency – which could ultimately help us identify players who are more consistent in generating offense, and potentially more preferable to an erratic chance generator.

Picture1

A few caveats. In the analysis I use Moneypuck’s Expected Goals on a per game basis, which shouldn’t be considered a perfect measure for encapsulating player performance. Expected Goals may underrate players who are able to outshoot their expectation (Auston Matthews), or someone who creates offense through distribution (Mitch Marner). A metric like Game Score, which may better encapsulate a players contribution in a given game, could be better for this but isn’t readily available on a per game basis.

– Mackinaw Stats

Huge thanks to MoneyPuck for Shot Data. All charts were generated by @MackinawStats

Fixing The Bottom Half: Analyzing The Leafs New Depth Additions

Kyle Dubas has rearranged the bottom half of the Leafs roster, replacing a few worn-out welcomes with some bargain bin finds.

Embed from Getty Images

The swarm of questions following the Leaf’s Game 7 loss on April 23rd may have averted any over-reflection on the part of Leafs fans on yet another first round exit. Instead of mulling over another lost season, the team was forced to answer some serious questions about its near-term outlook: Will Babcock remain the coach? When will Marner sign? Can they fit their current roster under the cap? These questions, and others, may have masked over the fact that major roster changes were both necessary (and incoming).

With a substantial portion of their cap going to their core players, Kyle Dubas and Co. targeted the bottom of their roster in effort to make improvements from last year. As the nearby graphic illustrates, players making up the bottom half of the roster were seen as expendable or replaceable, with over 60% of the highlighted players being shipped out or left unsigned.

Picture1

Besides young players that may have yet to see their full utilization on the club (Dermott and Moore), Dubas showed no hesitation in moving anyone from that group. Part of this strategy is inherent in a salary cap league – you try to lock up your core long-term and expect more instability with depth players that will come and go in search of more lucrative contracts. Despite this cycle, the Leafs certainly could have trotted out the same cast as last year, and crossed their fingers for a first round success – though the inaction could have cost them a key player like Kapanen or Johnsson. Instead, Kyle Dubas was aggressive in shedding bad contracts from the Lou Lamoriello era, and replacing them with players who can make an impact as role players at a good price. As the below graphic illustrates – the Leafs signed 8 players with cap hits below $1.5 M – the 8th most in the NHL.

signingsbar

The Leafs have made a total of 10 signings in the period from July 1st to July 26th, which the below graph displays (signings by week). Their cap situation limited their ability to go after any players above the $4.5 M and $3.5 M they spent on Cody Ceci and Alexander Kerfoot, with Kenny Agostino commanding the next largest salary at a whopping $738 K. Additional Week 1 signings included Jason Spezza, Nick Shore, and Kevin Gravel. After a two week lull, and the announcement of the David Clarkson trade, the Leafs announced a few more signings including Garrett Wilson, Pontus Aberg, Kalle Kossila, and Tyler Gaudet.

It’s worth quickly noting the Leafs PR announced 7 new contracts on Friday, but this chart includes the unofficial singing date for Nick Shore, Kevin Gravel, and Kenny Agostino, and so appear in Week 1.

leafsweeklysignings.png

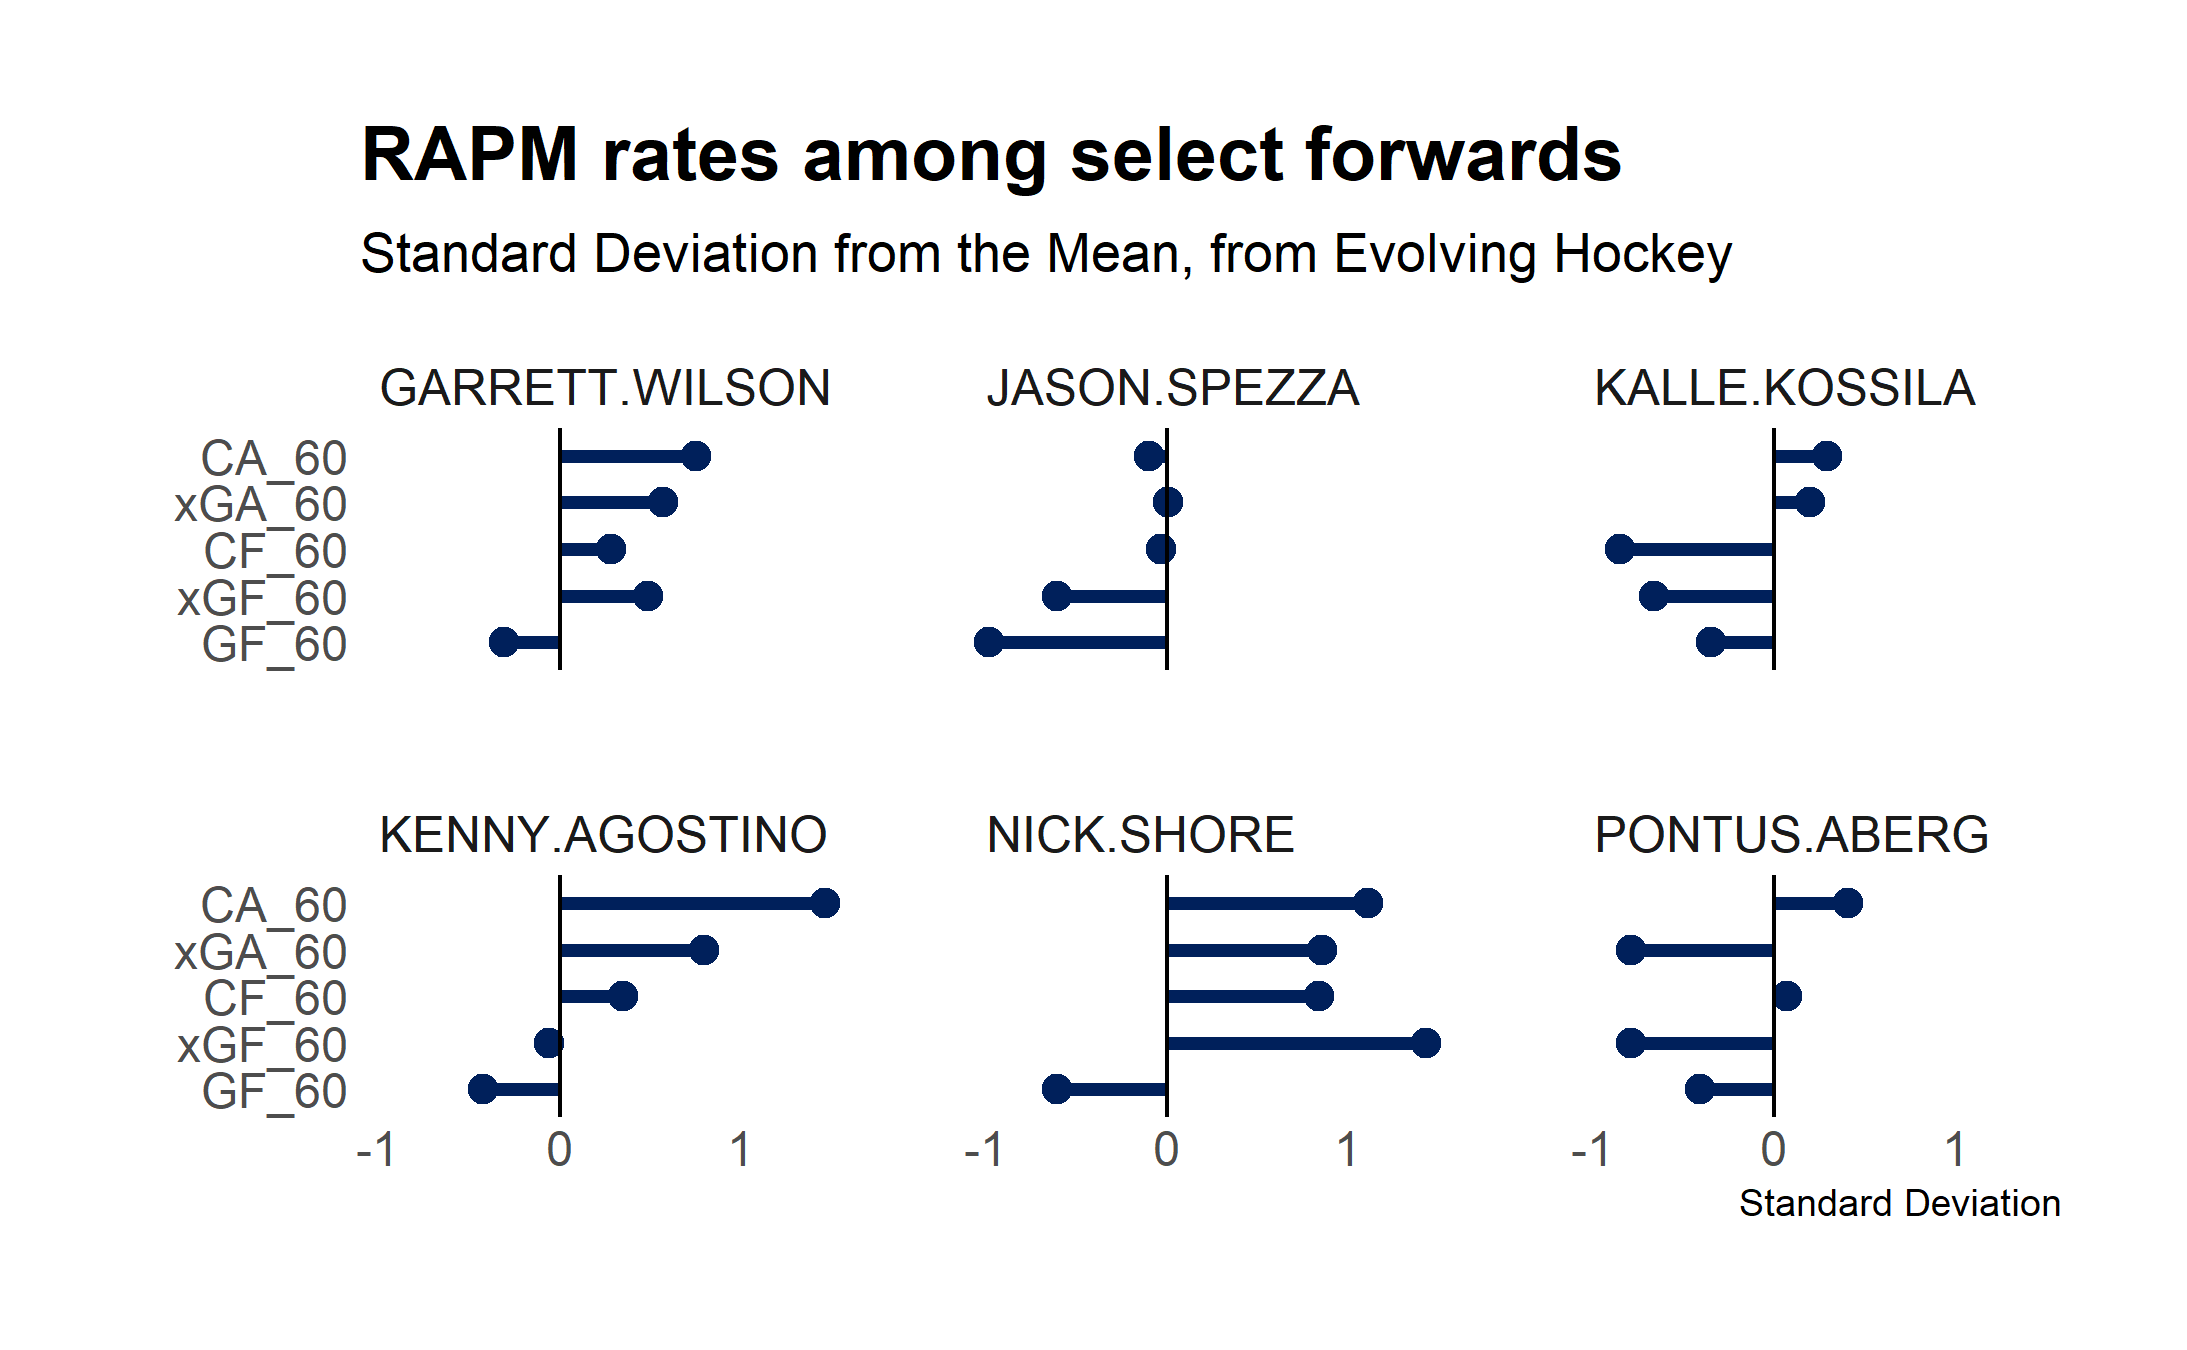
What are we to make of these new players? Will they just replace the mediocrity of players like Connor Brown and Patrick Marleau at a lower price? This is a possibility – from EvolvingWild’s RAPM statistic the new signings look like a mixed bag, with Kenny Agostino and Nick Shore appearing the most enticing. It seems reasonable that Kyle Dubas is treating these incoming players as lottery tickets – hitting on just one or two would go a long way in shoring up depth on the fourth line.

rapmchart

Of course it feels necessary to caveat this chart – these players are all coming from different teams and the systems and teammates they played with will impact any catch-all statistic like RAPM. Dubas may have targeted these players for other reasons that would go unidentified by data that is publicly available.

This leaves us in a bit of a wait-and-see attitude with regards to these new depth signings, as with the more major additions of Tyson Barrie and Alexander Kerfoot. Leafs fans will be counting down the seconds until they can see the new pieces in action. The good news? Only 50 days left.

-Mackinaw Stats

All charts created by Mackinaw Stats. Thank you to EvolvingWild for both Standard, RAPM and GAR data, and to CapFriendly for data on signings. You can read more about the RAPM model here.

Avoiding Bad Contracts: A Lesson From the Leafs

The Leafs have largely avoided bad contracts, which should help them contend in the years to come.

Embed from Getty Images

Despite the mayhem in Leaf land stemming from contract negotiations with Mitch Marner, and the necessary efforts to dispose of problematic contracts, things may not be as bad as they seem when it comes to the Leaf’s cap situation. The front office did need to do some quick work this summer to unload the Marleau and Zaitsev contracts – the crown jewels of the Lamoriello era – but their subtraction will have the Leafs well positioned to compete for a multiyear window moving forward.

The nearby chart shows the relationship between Cap Hit and Goals Above Replacement (GAR) among NHL players, with Leafs players highlighted in orange. GAR is a catch-all statistic that is designed to illustrate how valuable an individual player is relative to a ‘replacement level’ player. A replacement level player is a player who would be easily acquirable – think 13th forward or 7th defenseman. Players with a negative GAR could be easily replaced by a waiver pickup, or an AHL call up.

leafsgar

As you can see, the Leafs have largely avoided handing out large contracts to easily replaceable players. Cody Ceci, who Leafs fans are stuck with for only one more year (hopefully), is the only player on the roster with a negative GAR and a contract above $2M. The other negative GAR player is Ben Harpur, who should see a very limited role for the Leafs, and is only making $725 K. This is all to say that the Leafs aren’t paying a significant amount for players who they could easily replace – which seems like it should be the bare minimum expectation for an NHL GM, but the Oilers will provide us with a counterexample (which they are often good for, if you are looking to compare something that’s good to something that’s bad).

oilersgar

The Oilers have 4 players making more than $2M who are performing below replacement level. They have failed to surround McDavid and Draisaitl with a supporting cast despite paying meaningful sums for certain players (I’m looking at you, Lucic). The reasons why this matters are pretty obvious – you don’t want to be paying players that are easily replaceable because their production can be matched at a lower cap hit, or these dollars can be allocated to retaining star talent. Not to mention you’d obviously rather not have replaceable players at all, no matter what salary you are paying them.

deadweight

The nearby visual is an attempt to show the impact of “dead weight” players – that is players who are below replacement level, but having a cap hit above $2M – on wins. We see a slight downward trend as you move from having 1 player at this level, to having 5 players on your roster at this level. To be exact, this simplistic model suggests one additional “dead weight” player resulted in 3 less wins in 2018-19. Anecdotally, the teams with 4/5 players at significant cap hit at below replacement level include the Oilers, the Rangers, the Ducks, and the Kings. These teams aren’t fielding an optimized lineup and finish lower in the standings as a result.

Where does this leave the Leafs as we move ahead? Not paying bad players is a good start – we recently saw Ron Hainsey sign for $3.5M – avoiding deals like these will help keep them in contention. However, the Leafs have one defenseman (Morgan Reilly) under contract next year, and will need to develop or acquire good players to fill existing roles. Letting aging free agents like Gardiner and Van Riemsdyk walk is usually a good idea, but only if you can replace them with a better alternative. So if the Leafs want to avoid moving to the right on the graph above, they’ll need to figure out how to avoid overpaying for free agents while also filling the empty slots in their lineups.

How exactly this is carried out remains to be seen, keeping the prospect cupboard stocked by solid drafting would help, and bargain finds similar to those made by the leafs this summer should as well. You’ll find one final example of a team that has avoided this trap extremely well, despite their lack of playoff success, in the Tampa Bay Lightning.

tampagar.png

Thanks to EvolvingHockey.com for their GAR data – you can read more about their model at hockeygraphs.com

Salary data was pulled from HockeyReference.com

All visuals created by MackinawStats

Paying the Piper: How Negotiations Will Impact The Leafs Salary Distribution

The time has come for the Leafs to pay their stars – a look at how big contracts for big players will affect the rest of the roster.

Embed from Getty Images

Appeasing the 1%

By the close of 2018-19 season, most Toronto Maple Leafs fans were acutely aware of the incoming cap crunch being dealt with this season. In simple terms, the Leafs have a handful of really great players who needed new contracts as they entered their prime years, after already having proved they can produce at an elite level. John Tavares took $11M to become a Maple Leaf, Nylander claimed a long awaited $6.9M deal, and Matthews signed a monster extension at $11.6M per year. The Leafs continue to negotiate with Marner, while astronomical figures continue to float around – something in the $9.5-10M remains the most likely outcome.

So what will happen to the rest of the Leaf’s roster – how can they afford to pay all of these stars and keep solid role players around to balance the rest of the team? Ultimately, the leafs will field one the most unequal team in the NHL, and will need to be creative with signing depth forwards to make up for the extra cap dollars going to heir young core. The good news – the leafs front office is aware of the issue – and has a decent track record in these types of signings. Last year, Tyler Ennis and to a lesser extent, Par Lindholm were good signings that filled out the bottom of the roster. This year, they are rolling the dice on Teemu Kivihalme, and Ilya Mikheyev from Europe.

leafssalary

The stratification of the Leafs is already apparent when you take a look at the distribution of their salary going into 2018-19. The nearby graphic includes the Leaf’s roster to date, assuming a $10M cap hit for Marner, and the discounted cap hit for Tyson Barrie. The Leafs have a lot of players at the bottom of the distribution – mostly recent league minimum signings, and Dermott on his ELC deal. The next tier of players emerges with Hyman at $2.25M and ends with Rielly/Andersen at $5M. This gap, and the lack of players in the $1M-$3M range will be a persistent trend given the top-heaviness of the Leafs roster.

The typical signing in this range – a depth forward or low pairing defenseman – is money taken away from players in the middle/top of the salary distribution. Given the availability of options at league minimums (re: Spezza, Shore, Petan), it isn’t worth the extra salary for this type of player. Now the Leafs theoretically have plenty of cap space next year ($26M according to CapFriendly) – but Morgan Reilly will be their only defenseman under contract, so there will be plenty of work to do. If the Leafs want to pony up the cash to resign Muzzin, Barrie, or go after another target in free agency or via trade – they will need to continue to stratify their lineup and use league minimums for depth forwards.

The Maple Leafs Will Be The Most Unequal in the NHL

We should expect the Maple Leafs to be one of the most unequal teams in the NHL for at least the next few years. One aspect of this is the ebb and flow of a rebuild – low draft picks develop into star players who command huge salaries and the fringe of the roster becomes less of a priority. The same trend happened to the Pittsburgh Penguins and Chicago Blackhawks as they developed their young talent. However, there is a growing feeling that RFA negotiations are deviating from the past in the amount of leverage that players have off of their ELC, especially among elite players. Matthew’s giant contract is already evidence of this, and the state of affairs with Marner has been attributed to a new attitude among younger players. This could push teams like the leafs to become even more unequal as stars soak up more of the cap.

To summarize the current state, I calculated the Gini coefficient, a commonly used measure for inequality, for each team in the NHL. The coefficient ranges from 0 to 1 , with 0 representing perfect equality (all players make the same) and 1 representing perfect inequality (1 players make all the money).

gininhl

As you can see, the Leafs are already the most unequal team, followed by the LA Kings and Tampa Bay Lightning. The Leafs are a lot like the Brazil of the real world – despite a high growth profile (GDP above 5% for much of the early 2000s) – rewards go to the top of the income distribution. Exactly how things shake out next year with the amount of cap space the Leafs have will be determined, but for now it seems like the “1%” will prevail and take a larger share of the slighting growing pie.

Data from HockeyReference, references of salary from CapFriendly.com. Visuals created by MackinawStats using R’s ggplot2.

– Mackinaw Stats

Can Kyle Dubas Improve The Toronto Maple Leafs Drafting?

This piece was previously contributed to Puck77.

The Toronto Maple Leafs have struggled to pick up talent after the first round of the draft. Kyle Dubas (and his scouts) will look to change that.

In a Sportsnet interview at the NHL Scouting Combine in Buffalo, a reporter started his question to Leafs GM Kyle Dubas by saying, “You don’t have a pick in the first round…”, but Kyle quickly and coyly jumped in “Not yet!”.

The comedic moment does have some implications – the Toronto Maple Leafs have largely struggled in the past decade in picking up NHL level talent after the first round. With their first pick coming at #53 overall, after their first round selection was sent as a part of the Jake Muzzin trade, the Leafs will need to improve their drafting ability in rounds 2 through 7 in order to start restocking their prospect cupboard.

A Look At The Past

As mentioned, the Leafs have struggled throughout the past 10 years at picking up NHL quality players after the first round. They made no mistakes with Auston MatthewsWilliam Nylander, and Mitch Marner. But, success has been limited after those three. The graph below depicts the Leafs selections by round and uses their Games Played as a metric of success.

visual created by Ryan Ghizzoni, data from hockey-reference.com

As you can see, besides the 1st round selections, Connor Brown is the only Leafs player above 200 games played. Travis DermottJosh Leivo and Andreas Johnsson were good selections and have made an impact for the big club, but the rest are mainly AHLers who fizzled out and provided little in value. None of this is to say that drafting in later rounds is easy – other analysts (Michael Schuckers, notably) have illustrated the steep drop-off in talent after the top round 1 selections. However, the Leafs have consistently under-performed in games played by draftees after round 1 when you compare them to the league average in drafting in every year since 2010. The below visual shows just how far off the Toronto Maple Leafs are.

visual created by Ryan Ghizzoni, data from hockey-reference.com

Specifically, the chart illustrates the average number of games played for selections after the 1st round of the draft. The grey line displays the league average for each year of the draft, with the Leafs in orange. The more recent things get, the harder it is to make concrete statements about success. Prospects can take several years to develop into NHLers. But, the Leafs will need to be better than they have to take another step on the road to cup contention.

*Trying* To See The Future

A staunch Leafs optimist would point out Mark Hunter‘s archaic drafting style of selecting big, tall defensemen only to see them stall out in juniors or the AHL, and point to Dubas’s progressive and analytical prowess as reasons for future success. A pessimist would point out the great difficulty involved in selecting players late in the draft, and question the impact one man can have on selections. The answer is usually somewhere in between – but I think guided by a GM that is willing to recognize changes in the skill makeup of the league should propel the Leafs to at least above average in draft ability, and hopefully even higher given their need for prospects and additional scoring depth moving forward.

Data from HockeyReference.com

Visuals from Ryan Ghizzoni

Toronto Maple Leafs head coach Mike Babcock has called for more forward depth. But, do they really need it?

This piece was previously contributed to Puck77.

Following the Boston Bruins’ Game 7 victory over the Toronto Maple Leafs, Mike Babcock had the following to say about the opposing team’s roster, according to an NHL.com article:

“It’s called depth, right?” Babcock said. “That’s how you beat the other teams. You need good goaltending, real good ‘D’ and you’ve got to be good down the middle. They have that.” (Quote from NHL.com)

It’s not the first time the coach has commented on depth – claiming that other teams in the NHL had done better at handling the adversity and injuries that comes along with a grueling 82 game season. Depth is always a good thing to have, and the more of it the better assuming you can fit everyone under the cap, but is this really a department the leafs need help in? Yes and no.

The chart below illustrates the Points per 60 minutes for all the teams in the Atlantic division. Each dot represents a player, and the large dot represents the team average. The horizontal line represents the league average for Points per 60 minutes.

visual created by Ryan Ghizzoni, stats from EvolvingHockey.com

As you can see, the Toronto Maple Leafs have the second strongest depth in the division in using this metric — only trailing the Tampa Bay Lightning who are notorious for their deep roster. Based on point production – the Toronto Maple Leafs are pretty well rounded, with decent per 60 contribution from 4th line players like Tyler Ennis.

Down the Middle

Where the Leafs could use more depth is down the middle, which became a focal point in the Bruins series when Nazem Kadri was suspended in Game 2, and the team was forced to move William Nylander off of Auston Matthews’ wing to third line center. Even with Kadri’s absence, finding a replacement for Frederik Gauthier could also help given his point contributions.

So how should they go about this? For more immediate needs, it seems like the Leafs have targeted overseas players as potential options – signing Ilya Mikheyev and Teemu Kivihalme to entry level contracts – but neither play center. Free agency might be a potential option, but Dubas will need to look for a bargain player and not a blockbuster signing to keep the leafs under the cap. An interesting development over the next few years will be how Dubas uses the Entry Draft to keep the Leaf’s prospect cupboard stocked. Taking advantage of the cheap ELCs of young phenoms will be huge given the amount of salary that will be locked up by the core, and given this is Dubas’ first full draft (he had just started before last year’s) – it could be a key one moving forward.

stats from EvolvingHockey.com and hockey-reference.com