Diving Deeper Than Averages
Since the advent of basic player statistics, per game or season averages have been frequently used to evaluate player performance, in all sports including hockey. Averages allow us to distill an overwhelming amount of information into a simple, catch-all number that can lead to a better understanding of player contribution. What has received slightly less attention than the average, is the variance of a player’s performance – or how often the average is representative of individual data points.
Essentially this is an evaluation of player consistency – is player X scoring a point a game for 5 games, or is he scoring 5 points in one night and 0 for the other 4 games? There may be preferential status granted to a player who is able to consistently perform: a role player who puts up a point every 3 games is potentially more valuable than one who scores 3 points in 1 game, and then 0 points in the next 8 games.
Let’s first take a look at the distributions of Expected Goals on the Toronto Maple Leafs – specifically this chart below. We can look at a players per game average to gauge who is performing well, but how do we evaluate consistency – who is more likely to perform closer to their mean in a given game? Ennis seems to have more volatile performances – is there a way we can quantify his volatility?
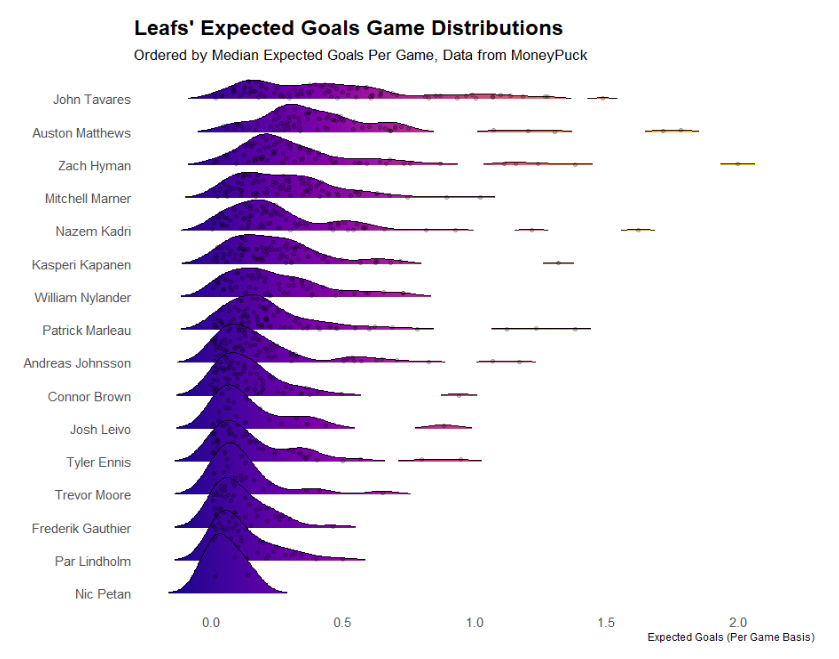
You’ll notice players at the bottom of the chart, with xG performances more clumped together, are players at the bottom of the leafs lineup. This isn’t all too surprising – Par Lindholm isn’t really capable of putting up an xG performance above 1.0 and so we shouldn’t expect his variance to be very high either: he’s consistently mediocre or bad. This fact should be taken into consideration when we go about creating a consistency metric.
Introducing Coefficient of Variation
The metric I plan on using is a player’s Coefficient of Variation – which has been used in the past to measure Fantasy Football players’ consistently – as in this piece. It’s very simply the player’s average in a given metric (xG in our case) divided by the player’s standard deviation for that metric. This will help distinguish players who are consistently bad vs. consistently good, or somewhere in between. I’ll consider the metric the “xG Consistency Rating” moving forward.
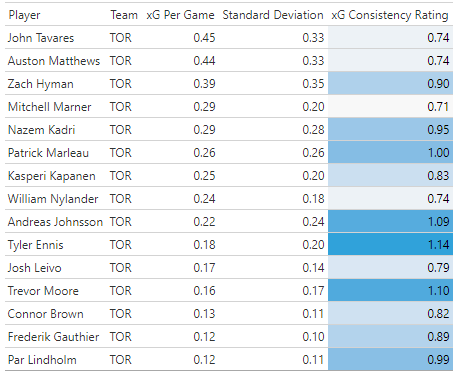
Given this calculation we should consider players with lower “xG Consistency” numbers to be more consistent, where higher ones (where the mean and standard deviation are closer) should be considered less consistent. For the Leafs, this metric matches up reasonably well with the eye test. Marner, Nylander, Tavares, and Matthews are the leafs most consistent players from an xG perspective, and they are known for consistently generating offense for the Leaf’s offense. On the more inconsistent side of the spectrum we find Ennis, Moore, and Johnsson – players who were subject to role changes, or had less ice time to play with to generate Expected Goals (we should also beware of small sample sizes, particularly for Moore).
Looking League-wide
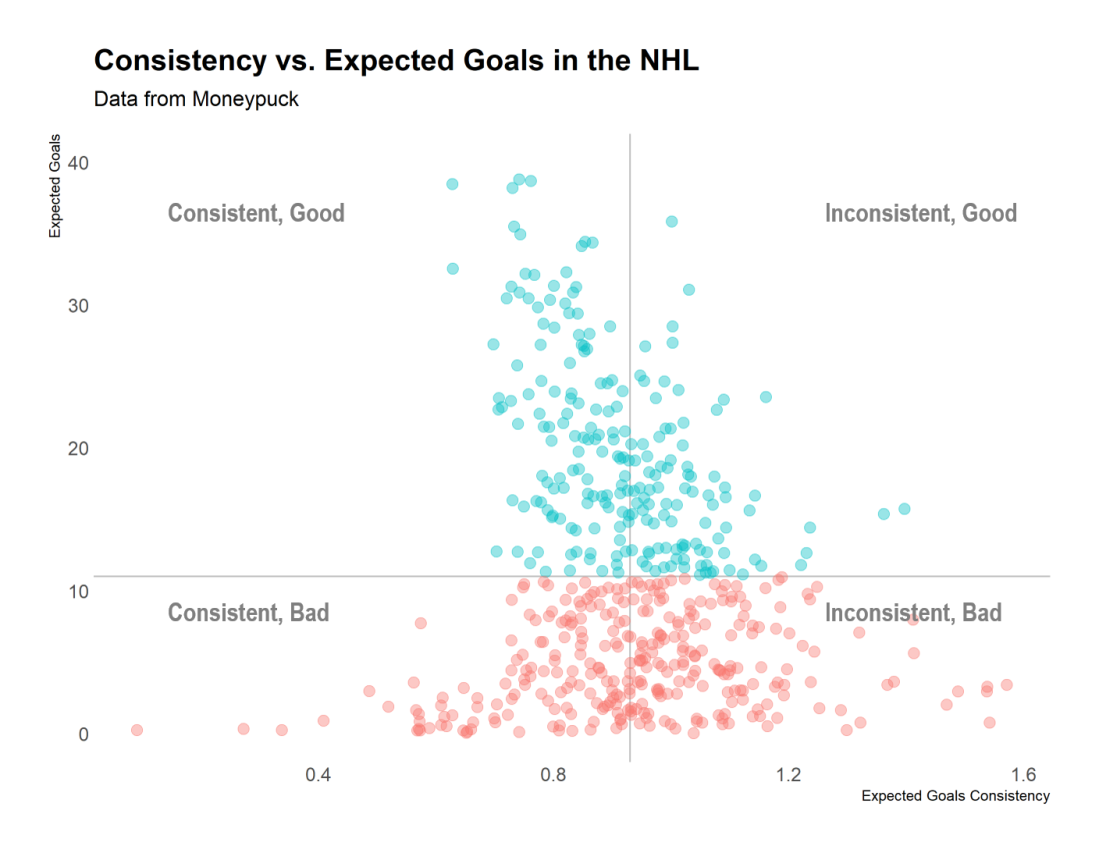
While this post has leveraged the Leafs as a case study in consistency, the metric can be applied to the larger league – and implemented to player evaluations using metrics beyond Expected Goals. The nearby chart is an illustration of Expected Goals vs. Expected Goals consistency – which could ultimately help us identify players who are more consistent in generating offense, and potentially more preferable to an erratic chance generator.
A few caveats. In the analysis I use Moneypuck’s Expected Goals on a per game basis, which shouldn’t be considered a perfect measure for encapsulating player performance. Expected Goals may underrate players who are able to outshoot their expectation (Auston Matthews), or someone who creates offense through distribution (Mitch Marner). A metric like Game Score, which may better encapsulate a players contribution in a given game, could be better for this but isn’t readily available on a per game basis.
– Mackinaw Stats
Huge thanks to MoneyPuck for Shot Data. All charts were generated by @MackinawStats
